
Mr Dalio's All-Weather Portfolio
How you can get some diversified momentum exposure in under 15 minutes a month.

After the drunken debauchery that was the bull market of 2020 and 2021, the markets took a turn for the worse in 2022, with high inflation and declining asset prices (or disappearing assets if they where Cryptographic). I don’t have to tell you that though, because if you are reading my finance centric posts, you probably know what happened last year. I just needed to write an ominous opening to today’s blog.
If you where really involved in markets last year, you might have heard about the resurgence of trend following. A simplistic strategy of buying up-trending assets and selling down-trending assets in the hope that said trends will persist into the future. Trend following performed admirably last year, with many managers having double digit returns in an otherwise dismal year for the big boys.

I too often pray at the altar of the Trend Follower, though I mostly spend my days picking up pennies in front of Hard To Borrow steam rollers. As a trader that perpetually walks the fine line between financial academic and retail degenerate, I can definitively tell you that on shorter term time frames, (think several minutes to a few days), markets tend to revert to their respective means. However, over longer periods of time, the momentum and trend following effect starts to take hold. This may be because markets are inefficient in the long term or because financial return distributions are non-gaussian or people are just dumb and like to chase shiny objects, whichever one works for you.
To illustrate, here are two plots that I spent way too much time making so I had to include them:


Here we have the average autocorrelation (correlation of todays return with a return N lookback days in the past) for all stocks in the SP500 and Russell 3000. If you look closely you can see the trend I speak of. Short term returns tend to exhibit little or even negative correlation while longer lookbacks show autocorrelation that turns positive. This is a fancy way of saying, asset trends are more likely to persist on longer timeframes. As such, we have decisive and conclusive evidence that trend following works. Don’t @ me.
Needless to say, having some exposure to diversified asset classes with a trend following approach would do some good for anyone’s portfolio. While the method I will outline today is a far cry from the robust systematic trend portfolios being run by the likes of these guys or these guys, it is a good starter system to wade in to the warm waters of the holy trend.
At the very least it should out perform the classic 60/40 portfolio, the demise of which had been most celebrated in 2022. Read on as I break down the implementation and if you’re make it all the way to the end, I’ll even drop some back-tested equity curves.
The Portfolio
I did not invent this portfolio, although I did do some back-testing and weighting work to get things right. I believe this portfolio was most recently made famous by the wonderful Mr. Ray Dalio (motivational speaker and author of “Principles”, also formerly ran that fund called Bridgewater).

I have created a Trading View template and watchlist to make it even easier to follow, so that you have no excuses as to why you aren’t trading this. Just click on the links to add the templates or use your own charting platform to follow along. Note that I am using Monthly Bars and have a 50 Month Simple Moving Average and my IBD Momentum Indicator on the bottom.
I know 70% of readers will scroll through this article, make a face like Mr. Dalio’s and go on with their life. Maybe 20% will actually heed my instructions and try trading this before getting bored after a month and returning to yoloing 90% of their accounts on 0dte SPY options. It’s ok, I’m here for you when you blow your fifth account, as well as for the 10% that might actually stick with this.
The Portfolio Constituents
First, we must decide what assets we want to trade. Since the goal here is to build a diversified yet simple portfolio we will use these five liquid ETF’s in our portfolio.
VTI - Equities
GLD - Gold
DBC - Commodities
TLT - Long Dated (20 year) US Bonds
IEF - Short Dated (7-10 year) US Bonds
I know this short list will bring tears of frustration to a true trend following trader who trades things like Butter and Live Cattle Futures, but for today we are keeping things simple.
The Rules
Keeping things simple means only two rules for our portfolio.
At the end of each month we will check two conditions for each of the five constituents.
Is price trading above its respective 50 month moving avg?
Is the multi period momentum above 0?
Now I know what you are thinking, what is the multi period momentum and how do I calculate it?
If you’re not familiar with the IBD momentum factor, we are simply calculating momentum scores from different time periods and creating a weighted average. Here’s the Formula used for our Monthly portfolio. Note that we are using Monthly bars four data.
0.4 * PctChg(C,4) + 0.2 * PctChg(C,7) + 0.2 * PctChg(C,8) + 0.2 * PctChg(C,11)
If your eyes glaze over reading that, just use the indicator included on the bottom of the Trading View layout from the link above.
If both of the above conditions are true, we want to include it in our portfolio.
Let’s check GLD for example:
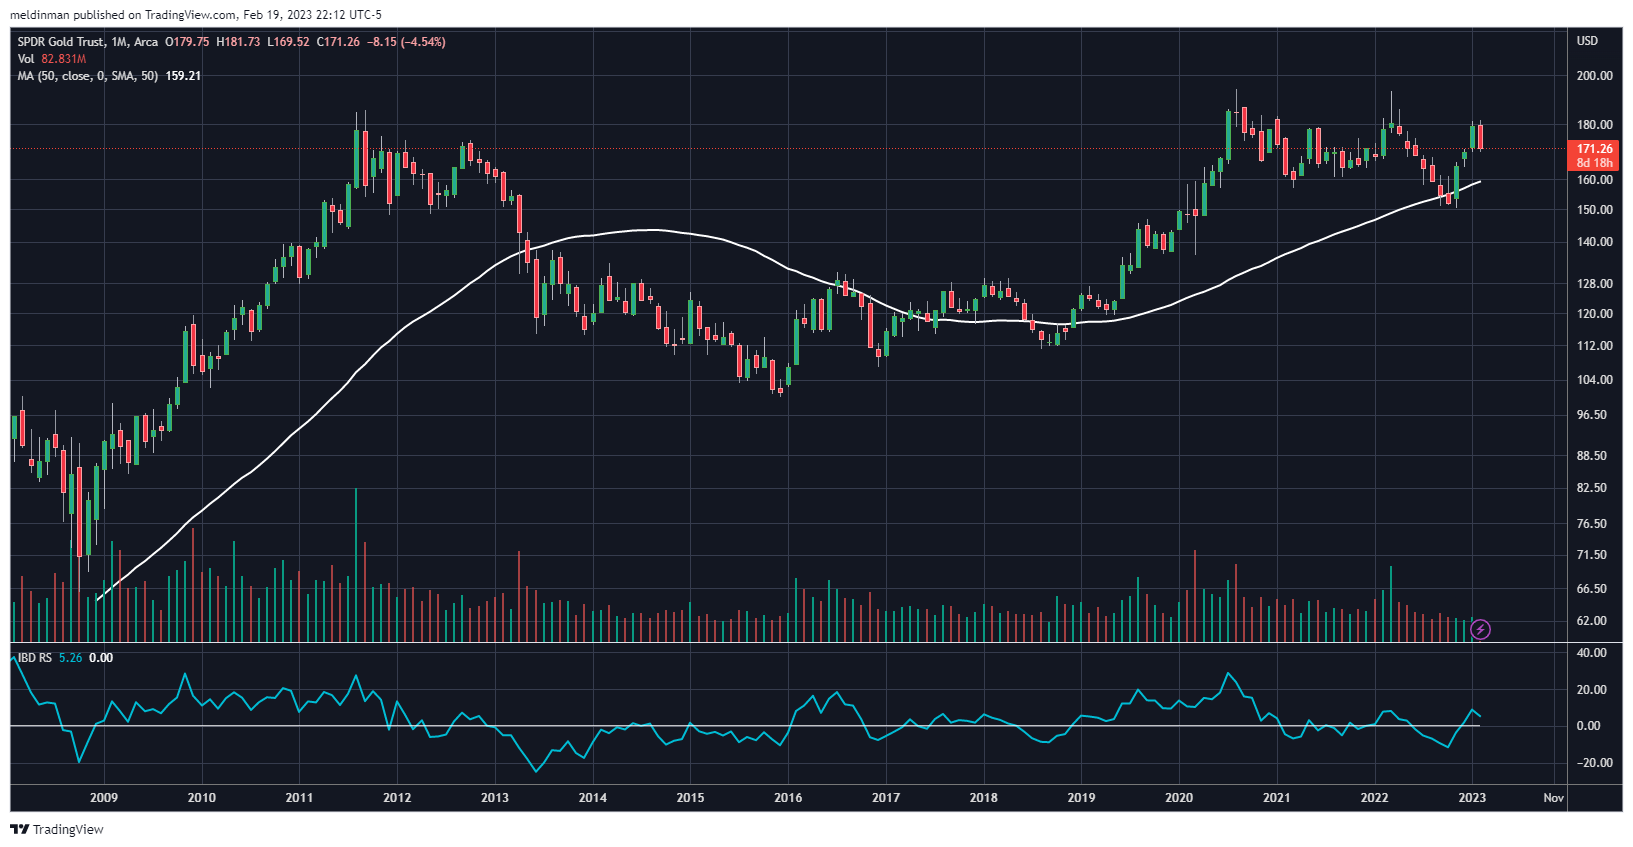
Is Price above the 50 MA? Yes
Is the Momentum Factor above 0? Yes
If both conditions are true at the end of the month than GLD would be included in our portfolio
Lets look at TLT:
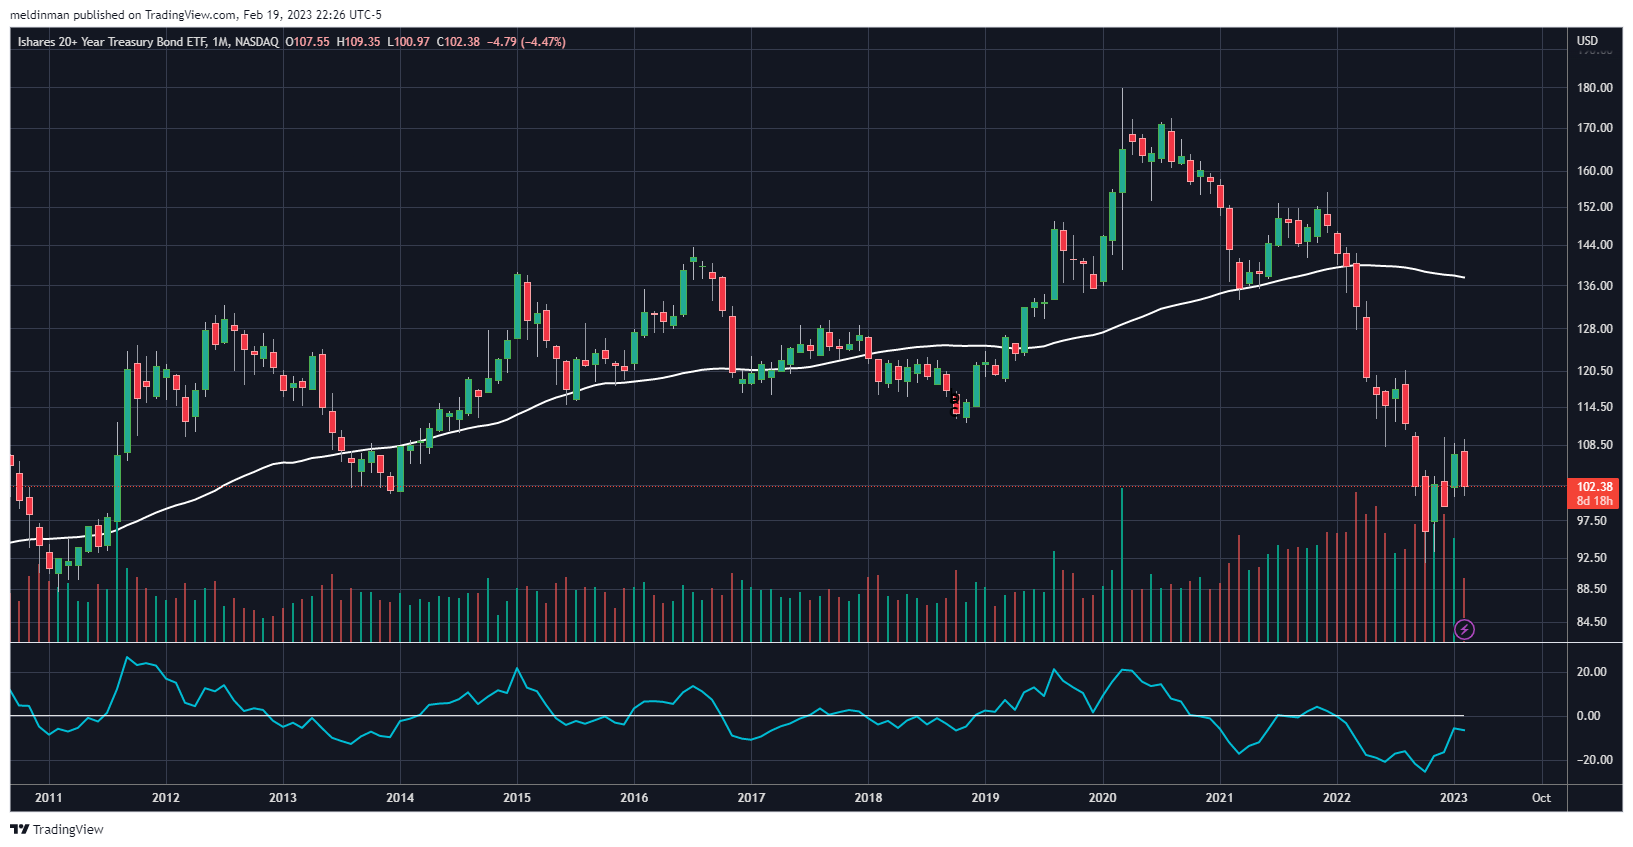
Is Price above the 50 MA? No
Is the Momentum Factor above 0? No
Then you know what to do with bonds right now…
Portfolio Weights
So we know what instruments to include and remove each month. But how much of each should we hold?
There are a few ways we can approach this. We could simply hold an equally weighted position of each and rebalance monthly. In a simple example, if we have a $50,000 portfolio, we would buy $10,000 worth of each position. If we had 3 eligible candidates in the portfolio this month, we would buy 3 * $10,000 positions and have $30,000 invested. If at the end of the month some positions went down and our portfolio was now worth $45,000, we would rebalance so that next month we have 3 * $9,000 positions for a total invested amount of $27,000. If this doesn’t make sense, maybe you should go back to rando-gambling some SPY calls.
In our portfolio, we are gonna jazz things up a bit by shifting the weightings to get closer to the 60/40 portfolio. We will keep the 40% weighting for the Bond part but lend some of the equity portion to the more volatile and diversifying Gold and Commodities.
The weights then are:
VTI - .5
GLD - .06
DBC - .04
TLT - .3
IEF - .1
There are many other ways to arrive at some fair weights without curve fitting that I plan to cover in a future write up, but for now I will use these weights. That means that at the start of each month, each position that has the green light to remain in the portfolio will be rebalanced (or entered, if its a new position) to a position size equal to the total portfolio value * the position weight. So for our previous $50,000 portfolio, a position in GLD would be entered with a notional size of $50,000 * .06 = $3,000.
Wrapping it all up (and the money shot)
That’s really all there is to it. I know it ain’t sexy, secret alpha, and it might even be a bit of a let down but my goal this week is to show how often the most successful strategies use very simple rules and techniques. The key to making any approach work really is in consistency and patience. If you do chose to follow this method, let me know how it goes for you and feel free as always to ask any questions.
And now, here is the back-tested performance of the strategy since 2005:
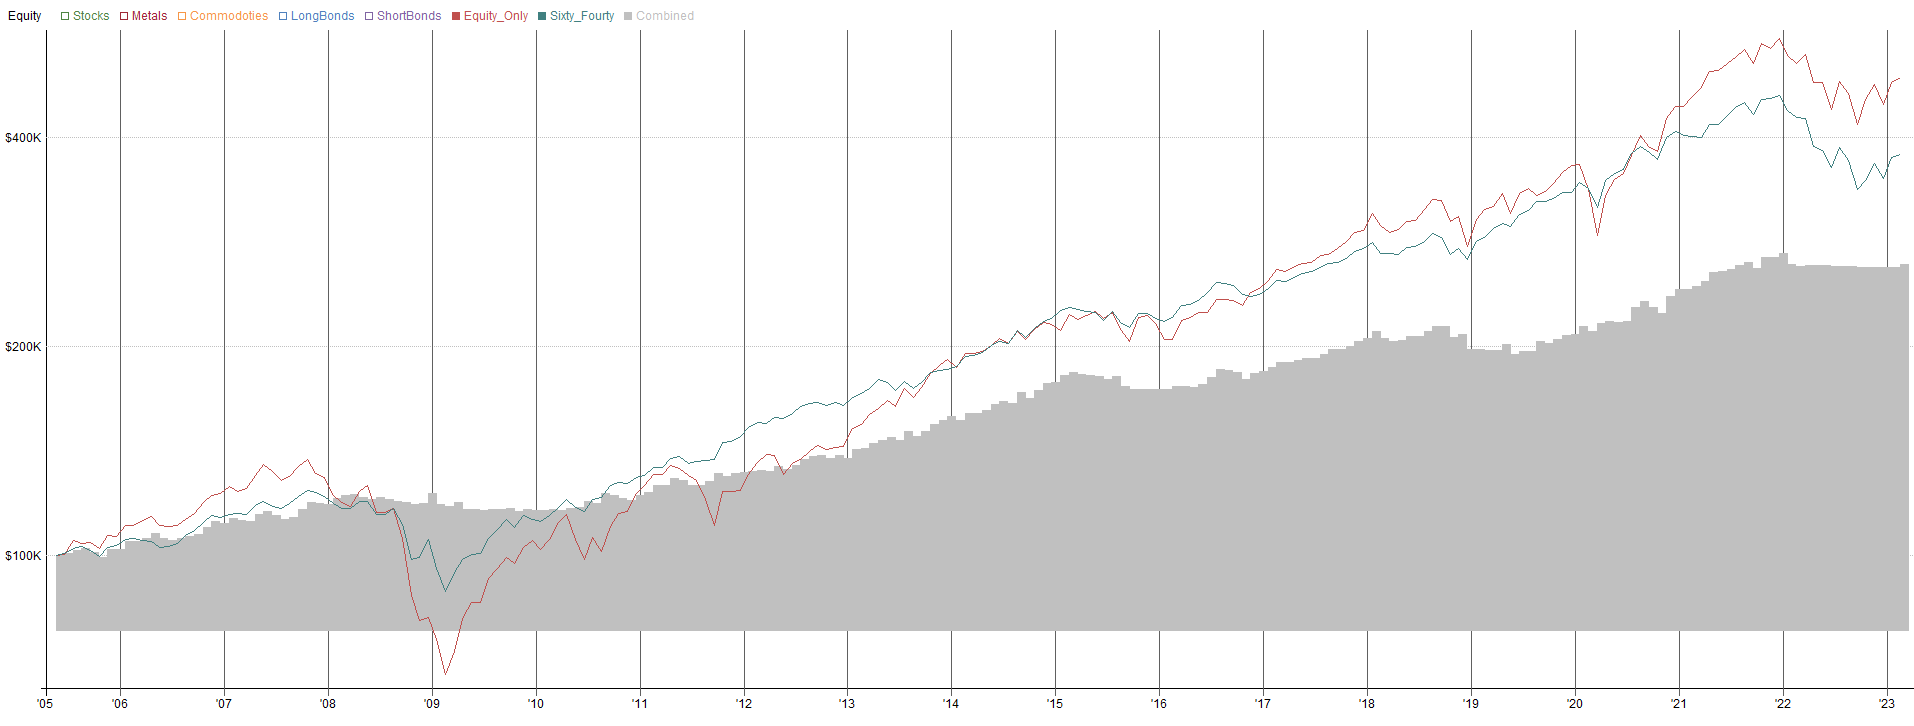
The gray line is the Portfolio equity, the red is using a buy and hold equity only and the green is a 60/40 portfolio rebalanced monthly. Must be a letdown to see our portfolio lagging the others. What a waste of time!
Let’s think about the results for a second. First, the equity only portfolio has the benefit of a strong secular trend for most of the test period and we have no way of knowing if that equity trend will continue into the future (hence the diversification). Second, take a look at some of my favorite stats for these three tests:
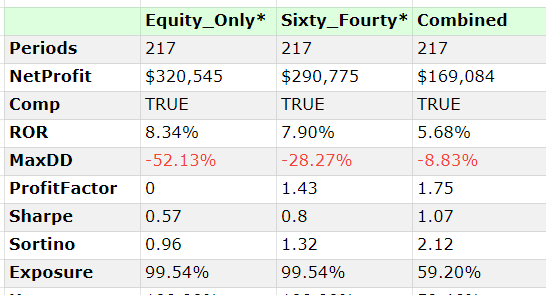
We can see that while the all-weather portfolio lags the other portfolios in Net Profit, it more than makes up on a risk adjusted (Sharpe or Sortino, whichever you prefer) basis. It also uses far less capital as we are often not fully invested in all positions. This means that we can expect a smoother ride when using this portfolio approach (other leverage based assumptions are left to the reader to arrive at).
That’s it for today’s write up, I hope this is a good base for those looking to start upon the path of rules based investing. In the future, I hope to expound upon this portfolio, incorporating things like portfolio weight optimization, single stock momentum, and futures strategies but for now I encourage you to take this portfolio and start implementing it each month. It only takes a few minutes and you might be surprised when it starts outperforming your gut-based options strategy.
Thanks for reading and see you next time!
If you enjoyed my writing, read some more!
Mendel, thanks for this valuable post.
I'm interested in the possible improvements of this portfolio as well as something similar for the EU ETF market ( at list for the italians trading US ETFs, I mean not armonized ETFs, is a tax bloodbath ).